Why We Built Adint
Bring clarity to physical engagement so teams can see where interaction begins and invest in what truly works.
Adint brings every QR scan into one dashboard - so agencies, marketing teams, and leadership see the same performance data.
Solo operator or testing a single workflow? Explore individual options.
Privacy-safe analytics that reveal where engagement starts and what drives results.
See whether your current physical campaign performance approach is ready for deeper attribution. Take the self-assessment.
A simple flow that connects physical touchpoints to actionable insight.
Connect QR codes to the placements and creative you want to test.
Every scan becomes a signal tied to the exact campaign context.
See which placements, regions, and creative sparked response.
Invest in what works and refine what does not.
We believe that awareness isn’t enough. Physical campaigns need attribution so teams can see what worked, repeat it, and stop wasting spend.
Bring clarity to physical engagement so teams can see where interaction begins and invest in what truly works.
Physical marketing should not be a blind spot. If you are investing in campaigns designed to spark interaction, you should know where engagement started, what placement performed, what creative triggered action, and what drove results. Adint makes physical engagement measurable and attribution clear.
Adint.ai helps brands and agencies measure engagement from response-driven physical media like direct mail, print, packaging, outdoor, retail signage, events, and publisher placements so teams can see what triggered action and optimize with confidence.
We connect real-world interaction to attribution so teams understand what sparked engagement and where to invest next.
Measure engagement without identifying individuals while still understanding patterns by placement, time, and region.
See which locations and placements sparked interaction so you know where to invest next.
Watch engagement unfold as it happens so decisions reflect what is working right now.
Tie scans to placements, creative, and campaigns so attribution stays clear across every channel.
Share attribution-ready views so everyone sees the same truth and acts with confidence.
Organize portfolios with roll-up visibility across brands, teams, and clients.
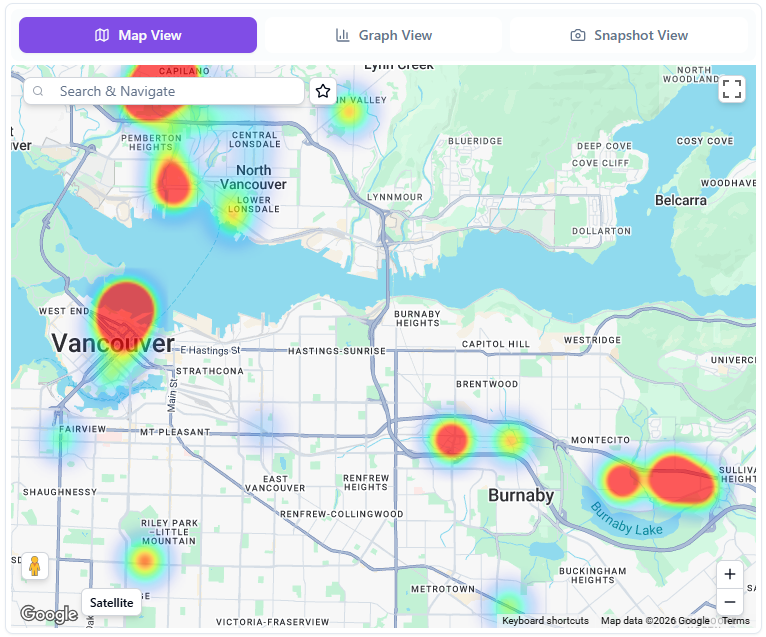
A live map showing response signals by placement and region.
See how professionals across industries turn physical interaction into confident decisions.
"We used to guess which store locations were driving engagement. ADINT.AI gave us the data we needed. The map view alone changed how we allocate our marketing budget across regions."
Regional Marketing Director
"Having campaign, location, and scan data in one place made reporting much faster. Our team can finally compare what is working across markets without stitching together spreadsheets."
Performance Marketing Lead
"Managing QR campaigns for multiple clients was a nightmare before this. Now? One dashboard, all the insights. Our clients love the reports and being able to log in and explore their data."
Senior Account Manager, Advertising Agency
"The distribution insights are incredible. We can now prove to publishers exactly where their print ads are performing and optimize delivery routes based on actual scan data."
Distribution Operations Manager
"Real-time notifications when our outdoor ads get scanned? Game changer. We've optimized our billboard placements and seen a 40% increase in engagement."
Head of Brand Marketing
"Client conversations are easier now because we can show clear evidence of engagement by placement, timing, and geography. It has strengthened both reporting and renewal discussions."
Strategy Director, Media Agency